Experimental Procedure
Open the virtual laboratory and enter the sample stockroom to obtain the material that you wish to test.
For this experiment choose coarse limestone. Select 1000g of material for your test. This will be placed in the sample holder along the bottom of your window.

Now screen this material to make a sample with a known definite top size. You do this using the Rotap screen shaker, which you will find in the Analytical Laboratories.

The analytical laboratory that is open for you is the particle size laboratory. Select the Rotap shaker. Decide on the top size that you wish to investigate. Any size smaller than 5mm will do. Place the pan (labeled 0) and your selected screen on the Rotap. Load the entire coarse limestone sample on the top screen and start the machine. Remove the material from the screens back to the sample holder for the grinding tests. Close the analytical laboratory.
You are now ready to run the experiment in the laboratory. Open the Experimental Laboratories and choose the Batch Grinding experiment.
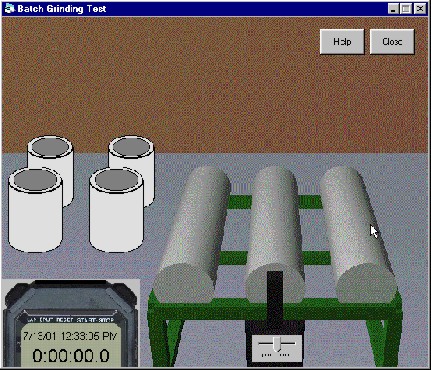
The purpose of the grinding test is to obtain the particle size distribution at four different grinding times. To do this efficiently, load four identical ball mills and rotate all four on the rollers. Remove one mill after 15 seconds, the next after 30 seconds, the third after one minute, and the fourth after two minutes. Collect the samples and measure the particle size distributions in the four samples and in the original feed sample.
Open the Experimental Laboratory and choose Batch Grinding from the Experiment List. You will find four empty ball mills and the drive rollers. It is important to ensure that each mill is loaded in the same way as all the others. They must have the same amount of solids, the same amount of water, the same ball size, and the same fractional filling. All four mills must be identical in size. For the purposes of this experiment, choose 8 x 9" mill shells for each mill.
Right click on each mill shell to choose the mill size and to load it. Load about 150g of the scalped coarse limestone feed into each mill. Add sufficient water to make the charge exactly 71% solids eq. 150g solid plus 61.27g water. Use 0.5" balls and load the media to 45% in the mill. Record all your choices in the Laboratory Notebook.
Set the roller speed to 5 and start the rollers by clicking the right-hand button on the stop watch. Stop the roller after about 15 seconds clicking the same button. Remove one mill. Run the mills for another 15 seconds and repeat until all the mills have been run for their allotted times. Remember to record the grinding times in the laboratory notebook when each mill is removed. Unload each mill. This is a good time to record the weight of all the samples in the sample holders.
The samples must now be filtered, dried and weighed, and the size distributions determined. Open the analytical laboratory again. The recommended procedure for the measurement of particle size distribution in the laboratory is to wet screen at about 40 microns and to dry the oversize for analysis in the Rotap screen shaker and treat the undersize by cyclosizer. In this experiment we are not particularly interested in the very fine sizes so the cyclosizer will not be used.
Filter the samples using the pressure filter. Dry the filtered samples in the oven and screen the dried sample in the Rotap. Be sure to select screens that include the top size for your experiment. Load the samples in the Rotap and record all results in the laboratory notebook. Dispose of the samples after each screen analysis and close the analytical laboratory.
This completes the laboratory work. Be sure to save your laboratory notebook using the main File menu.
Open a spreadsheet and open the saved laboratory notebook. The notebook is saved as a comma delimited file so it will open directly into the spreadsheet. Entries in the notebook that are separated by commas will import into separate cells of the spreadsheet.
Calculate the particle size distributions for the original scalped feed material and each of the four samples from the ball mills. Calculate the fraction remaining in the top size and plot this on a log scale against the milling time. This should produce a straight line of slope -k1. Evaluate k1 and post the value and the size range for the top size class on the bulletin board. When sufficient data are accumulated from students, we will be able to plot k1 against the representative size of the top size class. Before you undertake this exercise please check the bulletin board and choose a top size that has not been used by other students.