Exercise 3-2 Karra model for vibrating screens
Load the job from exercise 3-1. From the edit menu change the job name to exercise 3-2
Keep the same flowsheet consisting of a single screen and edit the system data to register the change in job name.
Edit the unit parameters. Note that the current model for the screen, SCRN, is shown at the top of the models list for the screen. Change the model to SCR2, set the screen mesh size to 3 cm and the screen length to 3.0 m and the screen width to 1.92 m. This gives a screen of area equal to that found necessary in example 3-1. Choose woven wire mesh with wire dimater 7.94 mm. All other parameters can be left at default values.
Run the simulation and view the flowsheet. Right click the screen icon to get the report file for the unit. Scroll through the report file to check the performance of the screen. Note the capacity factors and note that the area utilization factor is 1.11 This parameter has been found to be useful in assessing the results of a simulation of screening behavior using the Karra model. It is calculated as the ratio between the actual amount of undersize that is transmitted by the screen to the amount of undersize that the screen is capable of transmitting as calculated using the Karra model. Thus it gives a measure of the loading on the screen relative to its theoretical capacity. An area utilization factor less than unity indicates that the screen is under loaded while a value greater than unity indicates that the screen is over loaded. Since the screen chosen had the area suggested by the traditional model in Exercise 3-1, the Karra model indicates that the traditional model under estimates the required area by about 11% with the medium heavy woven wire mesh that we have chosen.
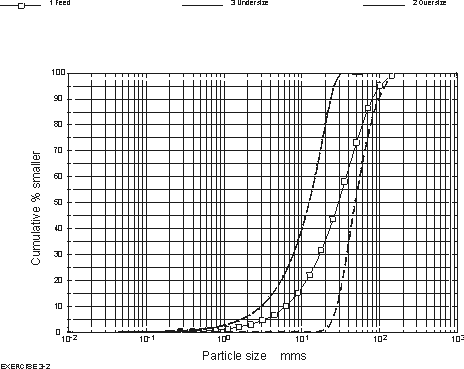
Look at the size distribution in the three streams from the view menu.
The report file and size distributions are shown below for reference.
You can now investigate a number of what-if scenarios. For example check how the area utilization factor varies as the wire diameter changes. Standard wire diameters for this mesh size are: heavy duty 9.53 mm, medium heavy 7.94 mm, medium 6.35 mm and medium light 5.72 mm.
You could also investigate how the area utilization factor varies as the feed rate changes.
You could also substitute a double check screen and simulate its performance.
Unit number 1 MODSIM model
name SCR2
Job name: Exercise 3-2
Tonnage to be processed
: 300. tons/hour.
Screen length is : 3.00 m
Screen width is : 1.92 m
Mesh aperture is : 3.00 cms
Wire diameter is : .79 cms
Screen is inclined at .00 degrees to the horizontal
PARTICLE SIZE DISTRIBUTION
IN THE FEED.
Size % passing
cms
12.6 98.11
8.92 92.70
6.31 82.22
4.46 68.00
3.15 52.85
2.23 39.09
1.58 27.91
1.12 19.42
.788 13.28
.558 8.97
.394 6.01
.279 4.01
.197 2.66
.139 1.76
.986E-01 1.17
.696E-01 .77
.493E-01 .51
.348E-01 .34
.247E-01 .23
.174E-01 .16
.123E-01 .11
.871E-02 .08
.616E-02 .06
.435E-02 .04
.000 .00
Calculated throughfall
aperture : 3.00 cms
Percent oversize in feed : 49.264 %
Percent half size in feed : 26.528 %
Near size in feed : 20.951 %
D50 for separation : 2.55 cms
Percent moisture in feed : 5.00 %
Bulk density of material in feed : 1603.00 kgs/m**3
Basic capacity factor A
: 22.964 tph/m*m
Oversize factor B : 1.009
Half-size factor C : 1.018
Deck location factor D : 1.000
Wet screening factor E : 1.000
Material weight factor F : 1.001
Near-size factor Gc : .865
Tonnage in underflow :
130.59 tph
Total capacity factor (B*C*D*E*F*Gc) : 88.88 %
Simulated efficiency : 85.80 %
Area utilisation factor
: 1.11
WARNING: This screen is overloaded. A larger screen should be
considered.
Calculated rate of travel
: .24 m/s
Bed depth at feed end : 11.08 cms
Bed depth at discharge end : 6.26 cms
PARTICLE SIZE DISTRIBUTION
IN THE OVERFLOW.
Size % passing
cms
12.6 96.65
8.92 87.08
6.31 68.52
4.46 43.33
3.15 16.53
2.23 2.39
1.58 .25
1.12 .02
.788 .00
.558 .00
.394 .00
.279 .00
.197 .00
.139 .00
.986E-01 .00
.696E-01 .00
.493E-01 .00
.348E-01 .00
.247E-01 .00
.174E-01 .00
.123E-01 .00
.871E-02 .00
.616E-02 .00
.435E-02 .00
.000 .00
PARTICLE SIZE DISTRIBUTION
IN THE UNDERFLOW
Size % passing
cms
12.6 100.00
8.92 100.00
6.31 100.00
4.46 100.00
3.15 99.95
2.23 86.70
1.58 63.79
1.12 44.58
.788 30.49
.558 20.60
.394 13.81
.279 9.21
.197 6.12
.139 4.05
.986E-01 2.68
.696E-01 1.78
.493E-01 1.17
.348E-01 .77
.247E-01 .53
.174E-01 .37
.123E-01 .26
.871E-02 .19
.616E-02 .13
.435E-02 .09
.000 .00
NOTES:
The screen was shown as operating without water sprays
Using water sprays could increase the capacity of the screen.
Surface water retained on the oversize 2.04 %