Liberation spectra around the ball mill
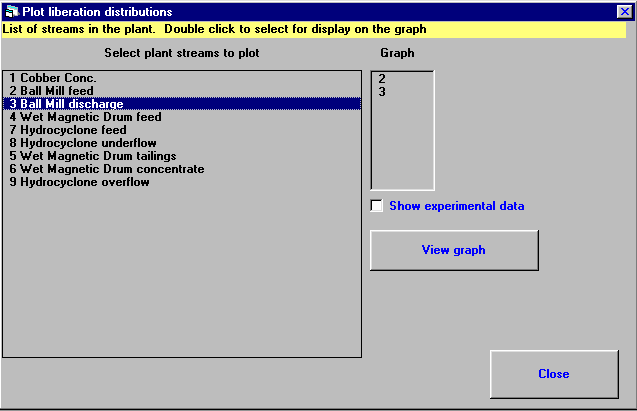
To view the liberation spectra in the ball mill streams select View->Liberation distribution graphs. The Plot liberation distribution s form is opened. This works similarly to the size distribution interface.
Double-click on the streams you want liberation spectrum to be displayed. The stream numbers are added to the Graph list. In this case we want to view the ball mill feed and discharge streams. Click on view graph.
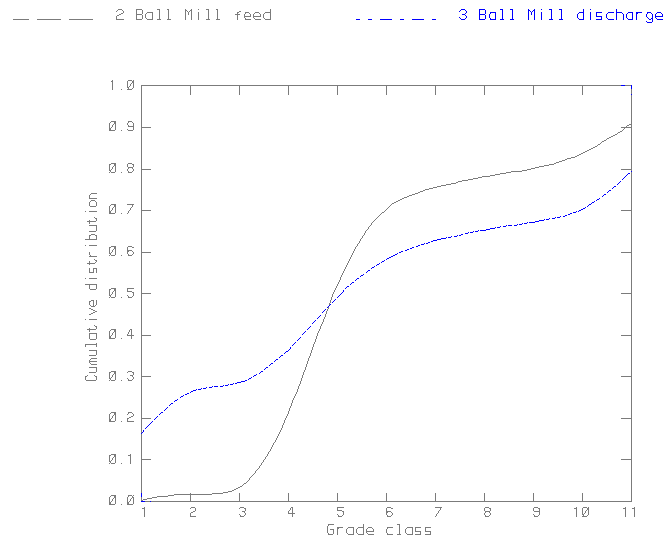
For each stream, the line represents the distribution of particle grades over all size ranges. The ball mill feed stream has no liberated chert particles and small amounts of low grade particles. It also shows that most particles are accumulating in the 30 to 50% Magnetite grade range. Also, about 9% of liberated Magnetite particles is present in the mill feed. This leads to an important and fundamental question: Do we want to further grind liberated Magnetite? The ball mill discharge on the other hand contains about 17% liberated Chert particles and 21% liberated Magnetite particles, and the unliberated particles are spread more uniformely over the grade domain. The mill is indeed doing its job!
Note: Why are there so few particles of low grade in the ball mill feed? See the liberation distributions around the Wet magnetic Drum.